Clement Airiohuodion

Welcome to My Page
View the Project on GitHub clembrain/Advanced_Statistics_Using_R_Studio
📺 Concrete Compressive Strength: Advanced Statistical & Machine Learning Analysis
🗕️ Date: June 2024 🧪 Domain: Civil Engineering | Statistical Modeling | Machine Learning 📊 Tools Used: R, RStudio, ggplot2, caret, xgboost, randomForest 📁 Dataset: Yeh, I.-C. (1998) - High Performance Concrete Laboratory Dataset 🖱️ Portfolio: View Full Repo
📌 Project Overview
This project explores the factors influencing concrete compressive strength using statistical and machine learning methods. With over 1,030 lab observations, we investigate ingredient proportions (e.g., Cement, Water, Fly Ash) and curing age to determine their predictive power on strength. The approach spans data cleaning, EDA, regression modeling, log transformations, and ML algorithms such as Random Forest and XGBoost.
🎯 Objectives
- Explore how material compositions impact concrete strength.
- Identify significant predictors using regression and hypothesis testing.
- Develop and evaluate predictive models using ML algorithms.
- Visualize data relationships, assumptions, and model performance.
🗒️ Dataset Description
| Variable | Description |
|---|---|
| Cement, Slag, Fly Ash | Binder materials (kg/m³) |
| Water, Superplasticizer | Fluid & admixtures (kg/m³) |
| Coarse/Fine Aggregate | Fill materials (kg/m³) |
| Age | Days since casting (1–365) |
| Concrete Category | Based on aggregate ratio (Categorical) |
| Contains Fly Ash | Binary (TRUE/FALSE) |
| Compressive Strength | Target variable (MPa) |
🔍 Data Preparation & Exploration
📌 Key Steps:
- Removed 78 duplicates
- Treated skewed outliers using median replacement
- Converted categorical variables to factors
- Handled type inconsistencies and formatting
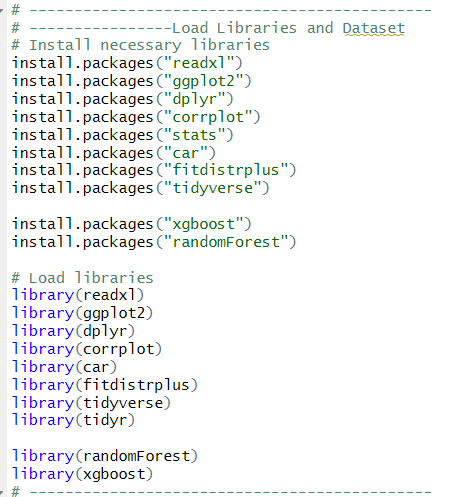
Installing and loading libraries for data analysis.

The dataset was imported using “read_excel” R-code above.
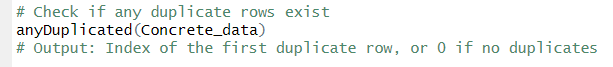
With the code above, 78 duplicates were seen
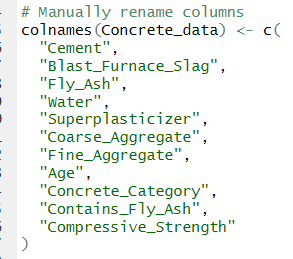
Variable names were rewritten for ease of use during analysis using the “colnames”
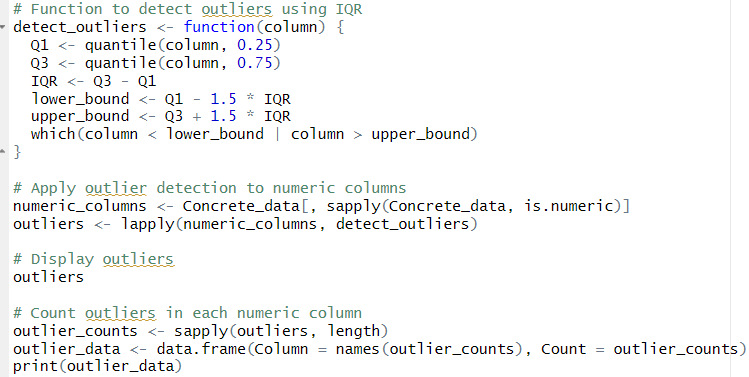
Above is the r-code I used to detect outliers in numeric columns
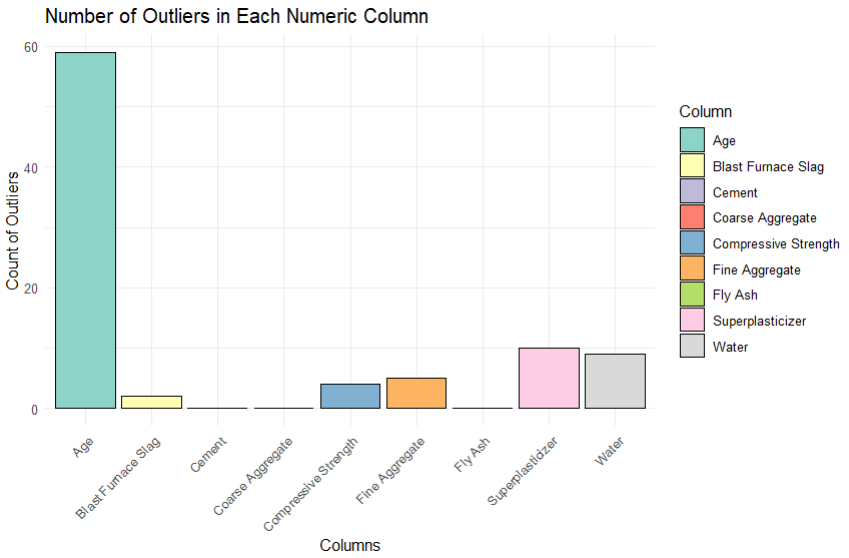
Ploting the above, visualises outliers counted for each Variable.
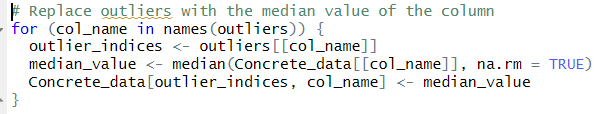
This steps above help replace outliers with median values of respective columns
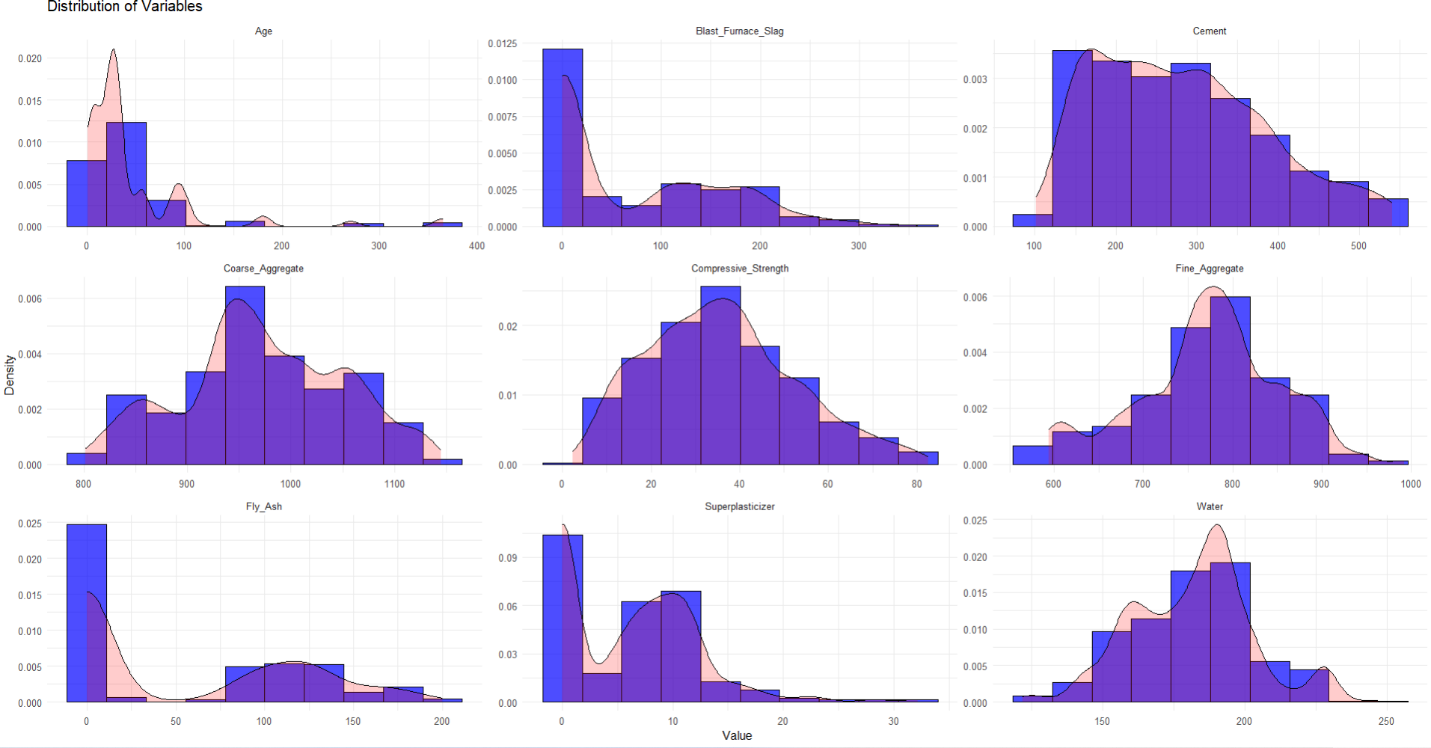
The above visualises distributions of all continuous variables using histograms and density plots.
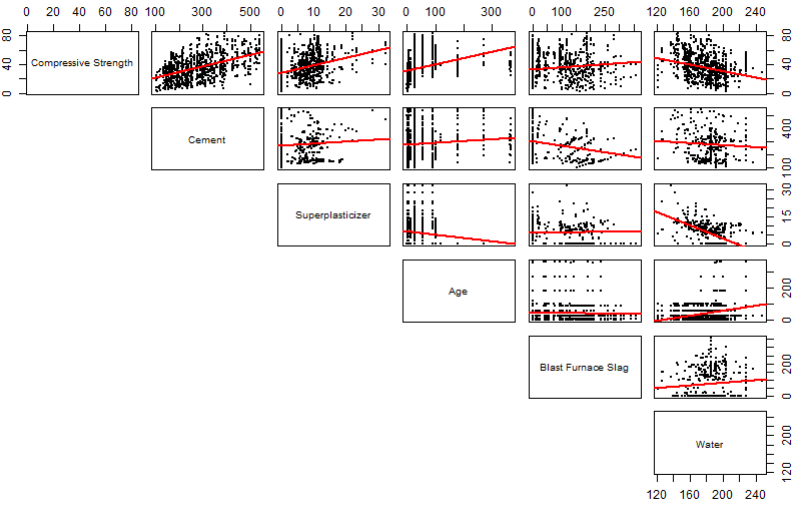
📈 Correlation & Exploratory Analysis
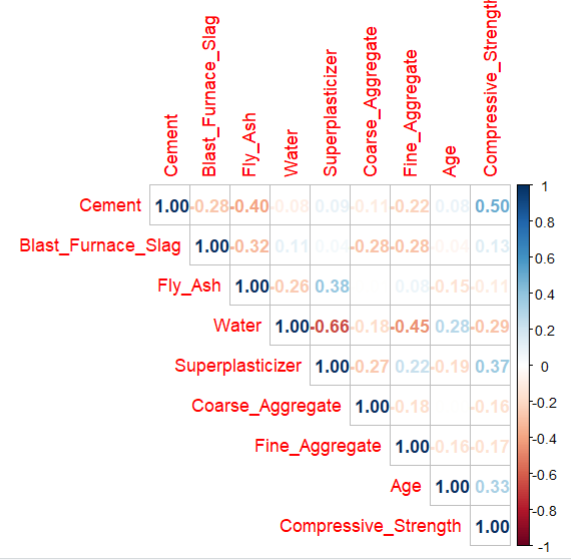
The code calculates the correlation matrix for my numerical variables and displays the correlation matrix
- Strongest correlation: Cement vs Strength (r = 0.50)
- Superplasticizer and Age: Moderate positive correlation
- Water: Negative correlation (r = -0.22)
📊 Regression Modeling
1️⃣ Simple Linear Regression (SLR)
Strength = 13.44 + 0.08 * Cement
R² = 0.25
2️⃣ Multiple Linear Regression (MLR)
The above select the variables by their number of arrangement in the dataset to show a matrix of linearity between “IV’s” and the target variable.
Strength = 0.07*Cement + 1.11*Superplasticizer + 0.10*Age - 0.08*Water
Adjusted R² = 0.58
/screenshots/residuals_plot.png - Residual distribution
📊 Log Transformation Model
- R² = 0.79
- Improved variance, passed assumptions
/screenshots/log_model_result.png - Log-transformed residual plots
🤖 Machine Learning Models
✅ Random Forest
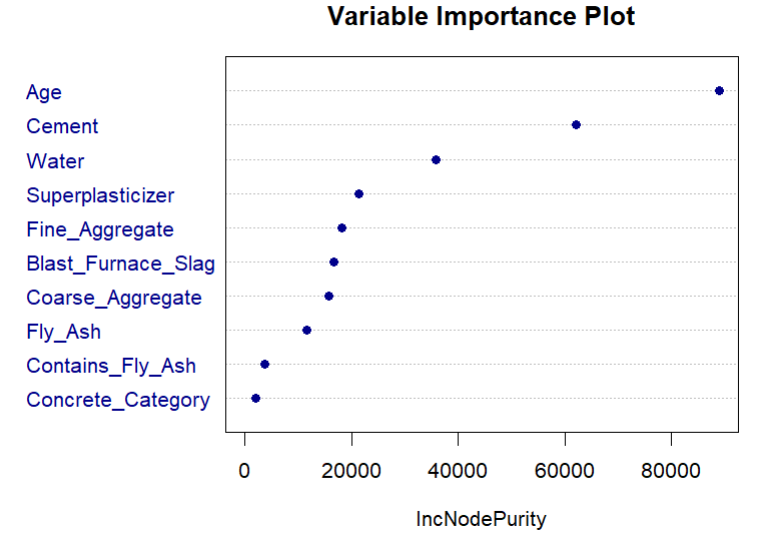
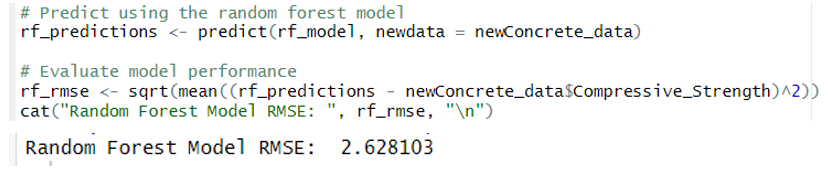
Above is the plot of the variable importance of each variable based on the Node of Purity. It has an RMSE of 2.628103
- R² = 0.92
- RMSE = 2.63
- Top features: Cement, Age, Superplasticizer
/screenshots/rf_importance.png - RF Variable importance
✅ XGBoost Regressor
- R² = 0.997
- RMSE = 0.91
/screenshots/xgboost_metrics.png - XGBoost performance
📊 Hypothesis Testing
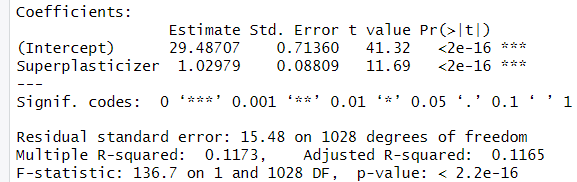
- Superplasticizer: p < 0.001 ✅
- Water: p < 0.001 (negative effect) ❌
- Fly Ash: weak positive correlation
- ANOVA: No significant difference across categories
- Interaction: Fly Ash × Category is significant
✅ Conclusion
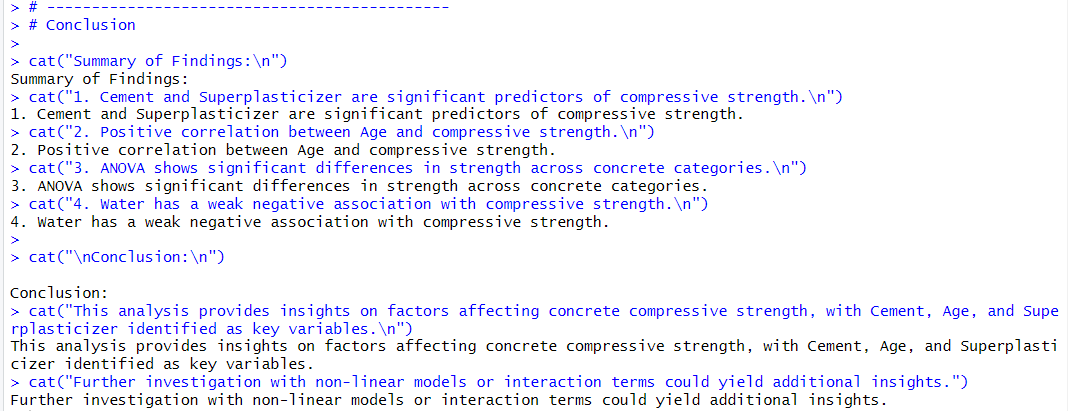
XGBoost was the top-performing model with 99.7% accuracy. Cement, Superplasticizer, and Age positively impacted strength. Excess Water had a negative effect. This analysis helps civil engineers design optimized concrete mixtures with stronger, more durable structures.
🔗 Access the Full Portfolio
- 📁 GitHub Repo
- 📸 Place all visuals in
/screenshots/directory for automatic rendering