Clement Airiohuodion

Welcome to My Page
View the Project on GitHub clembrain/Marketing-Mix-Modeling-Approaches
📊 Marketing Mix Modeling Enhanced with Machine Learning
Time Series Adventure
🚀 Project Overview
This project introduces a hybrid analytics framework designed to overcome the limitations of traditional Marketing Mix Modeling (MMM) by integrating modern machine learning techniques. It delivers enhanced attribution accuracy, real-time responsiveness, and predictive capabilities to optimize marketing strategy and return on investment (ROI).
Using a rich marketing dataset from Conjura, the solution models revenue impact across multiple digital platforms (Google, Meta, TikTok), implements classification for high-revenue periods, and performs budget optimization simulations for marketing efficiency.
📚 Key Features
- Machine Learning Models: Implements XGBoost, Random Forest, Ridge, and Linear Regression for revenue prediction and classification tasks.
- SHAP Interpretability: Uses SHAP (SHapley Additive Explanations) to decode model decisions and identify top predictive features.
- Multi-Touch Attribution: Breaks down the contribution of impressions, clicks, and spend from various channels.
- Budget Optimization: Simulates reallocation strategies and applies constrained optimization to maximize ROI.
- Time Series Forecasting: Utilizes SARIMA to forecast long-term revenue trends and seasonal cycles.
- Scenario Testing: Tests different “what-if” marketing strategies to guide decision-making.
🧪 Technologies Used
- Python Libraries:
pandas,numpy,scikit-learn,xgboost,statsmodels,matplotlib,shap,scipy - Modeling Techniques:
- Regression: Linear, Ridge, Random Forest, XGBoost
- Classification: Binary Classifiers with AUC/ROC
- Forecasting: SARIMA for 2-year projection
- Optimization: SLSQP constrained optimization
- Explainability Tools: SHAP (TreeExplainer)
- EDA Tools:
seaborn,matplotlib,plotly
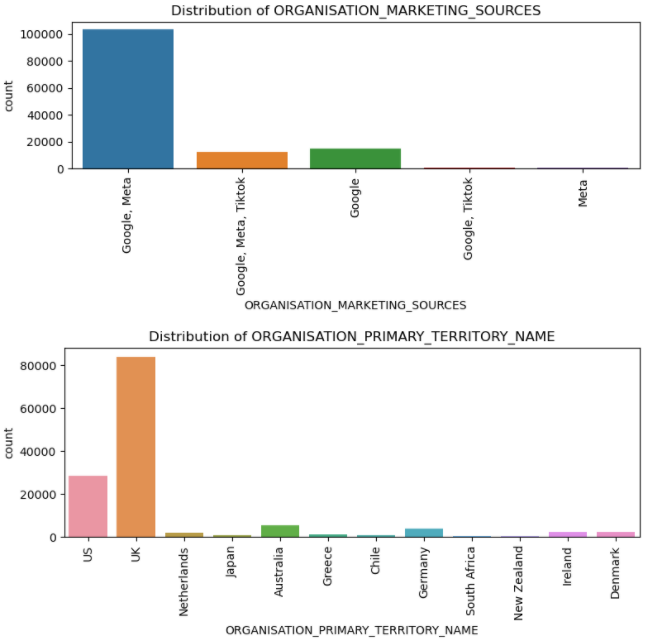
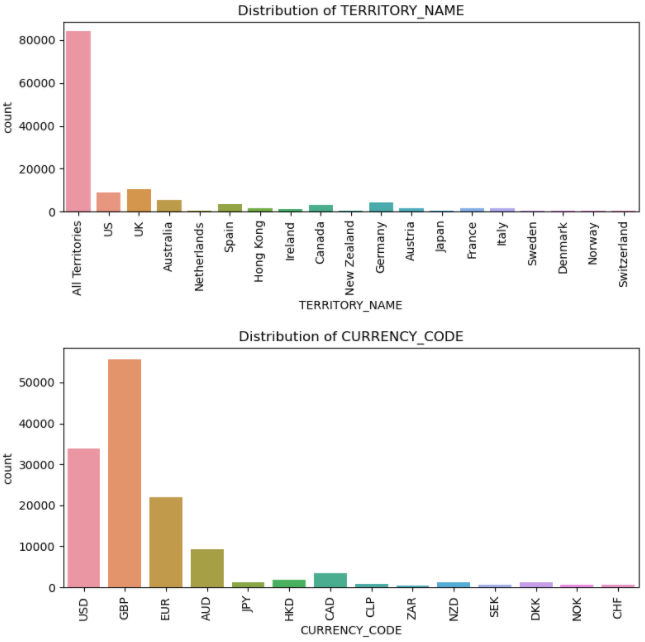
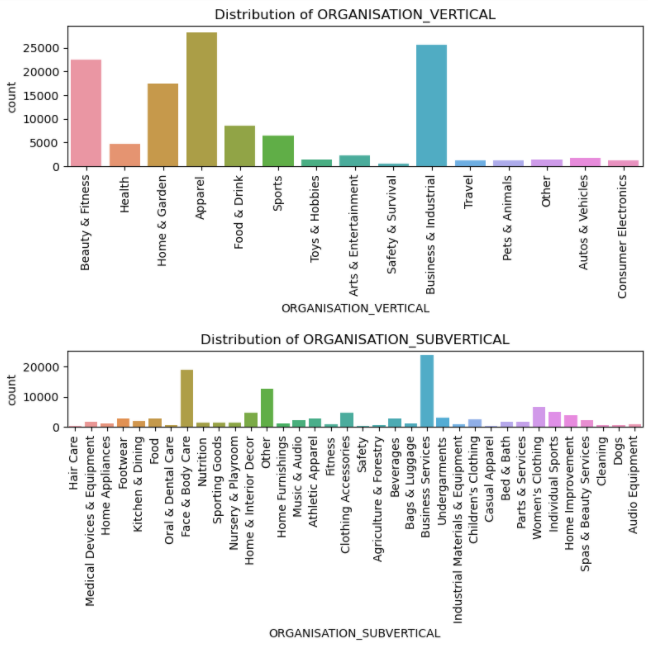 Figure 1: Categorical Feature Distributions
The structural diversity of the dataset is emphasized by the distribution charts. The “Business & Industrial” and “Apparel” sectors comprise the majority of organizations. The two most popular marketing platforms are “Google & Meta.” The two largest territories are the US and the UK, and the most common currencies are USD and GBP.
Figure 1: Categorical Feature Distributions
The structural diversity of the dataset is emphasized by the distribution charts. The “Business & Industrial” and “Apparel” sectors comprise the majority of organizations. The two most popular marketing platforms are “Google & Meta.” The two largest territories are the US and the UK, and the most common currencies are USD and GBP.
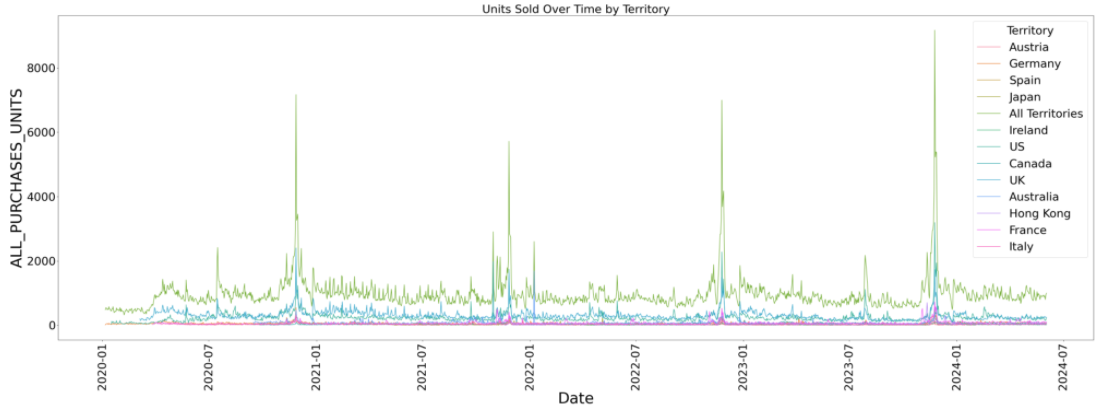 Figure 2: Units Sold Over Time by Territory
Multiple territories’ weekly unit sales are tracked by the line plot.
Figure 2: Units Sold Over Time by Territory
Multiple territories’ weekly unit sales are tracked by the line plot.
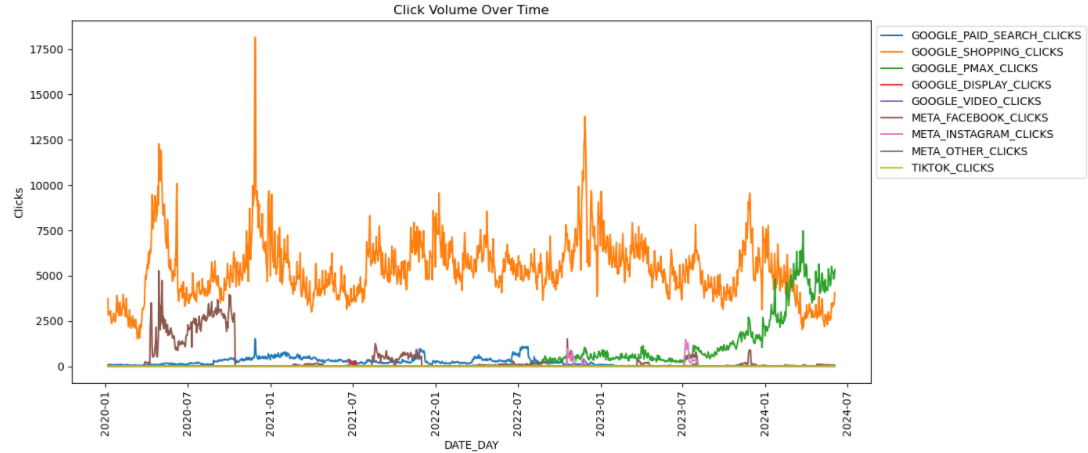 Figure 3: Click Volume Over Time by Channel
The volume of user clicks across marketing channels is displayed in this time series. Early on, META FACEBOOK CLICKS was the most popular, but more recently, GOOGLE PMAX CLICKS has become more popular.
Figure 3: Click Volume Over Time by Channel
The volume of user clicks across marketing channels is displayed in this time series. Early on, META FACEBOOK CLICKS was the most popular, but more recently, GOOGLE PMAX CLICKS has become more popular.
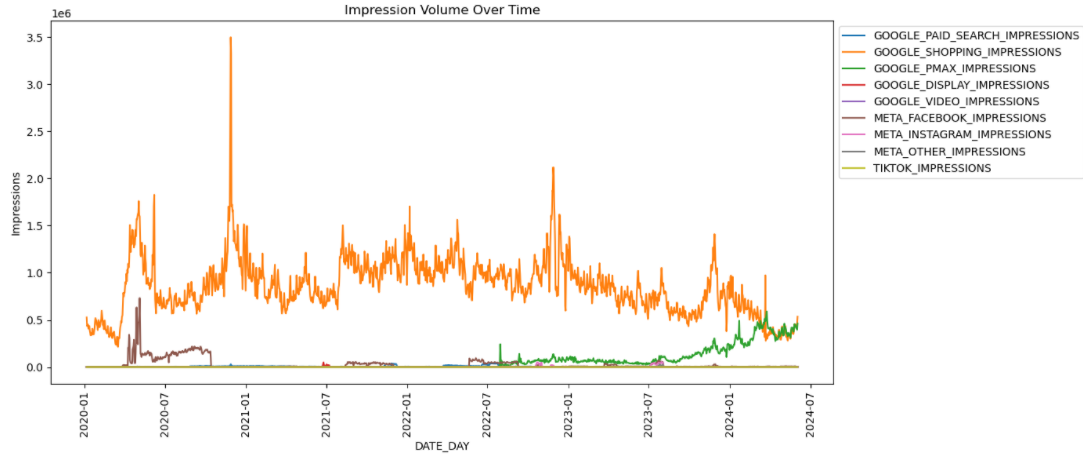 Figure 4: Impression Volume Over Time by Channel
Click dynamics are generally reflected in impression trends, with Google Shopping constantly achieving high visibility. Frequent surges in impressions point to intense campaign outbursts, especially in PMAX.
Figure 4: Impression Volume Over Time by Channel
Click dynamics are generally reflected in impression trends, with Google Shopping constantly achieving high visibility. Frequent surges in impressions point to intense campaign outbursts, especially in PMAX.
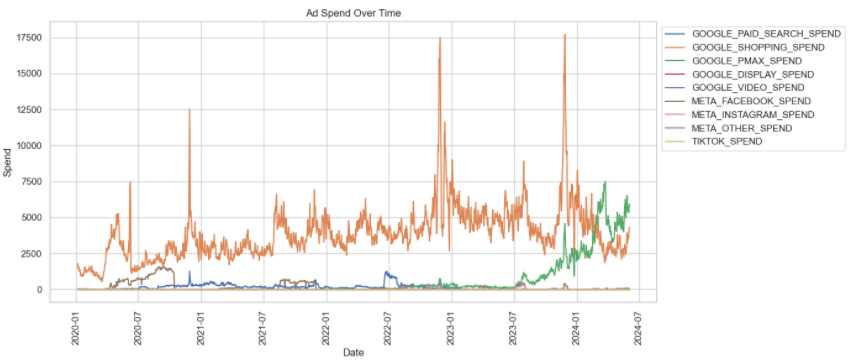 Figure 5: Spend Over Time by Channel
The temporal patterns in ad spend across the main digital marketing platforms are depicted in this time series graphic. The biggest investment was always made in Google Shopping, with sporadic budget increases that were probably caused by strategic pushes or seasonal marketing. A noticeable increase in Google PMAX spending recently points to a change in the technique for allocating funds toward campaigns that maximize performance.
Figure 5: Spend Over Time by Channel
The temporal patterns in ad spend across the main digital marketing platforms are depicted in this time series graphic. The biggest investment was always made in Google Shopping, with sporadic budget increases that were probably caused by strategic pushes or seasonal marketing. A noticeable increase in Google PMAX spending recently points to a change in the technique for allocating funds toward campaigns that maximize performance.
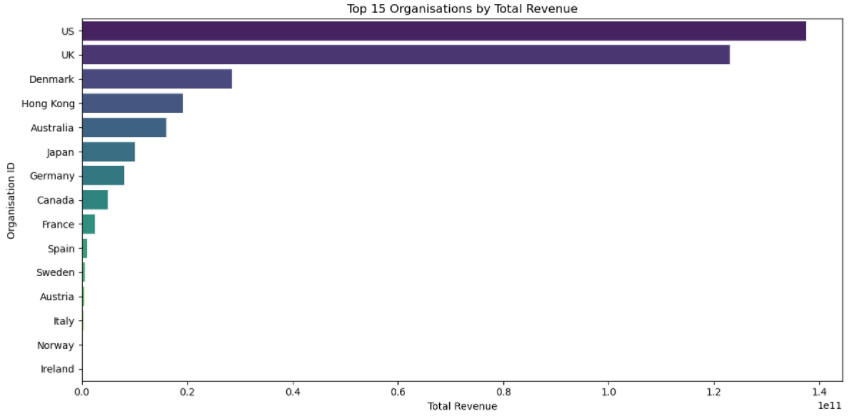 Figure 6: Territories by Total Revenue
The US and the UK contribute far more to overall revenue than any other country, followed by Denmark, Hong Kong, and Australia
Figure 6: Territories by Total Revenue
The US and the UK contribute far more to overall revenue than any other country, followed by Denmark, Hong Kong, and Australia
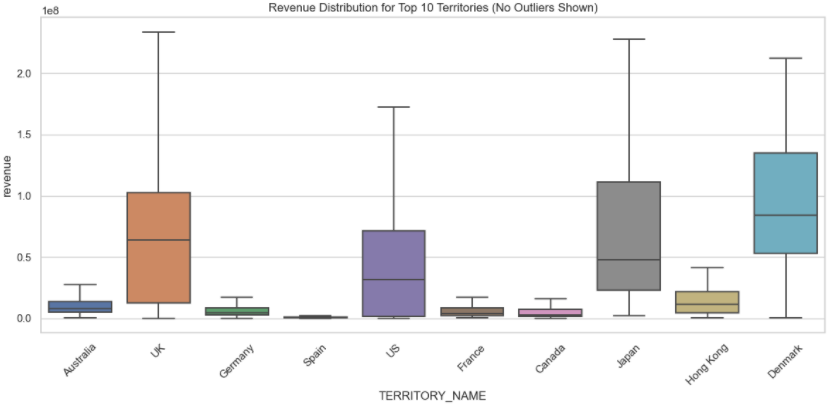 Figure 7: Top 10 Territories (Boxplot)
Without outliers, the revenue distribution for the top 10 territories shows a range of central tendencies and spread as seen in (Figure 7) above.
Figure 7: Top 10 Territories (Boxplot)
Without outliers, the revenue distribution for the top 10 territories shows a range of central tendencies and spread as seen in (Figure 7) above.
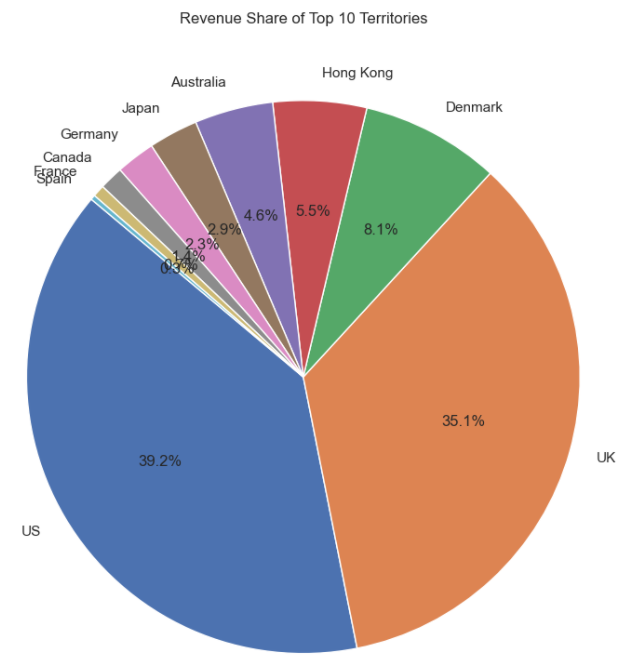 Figure 8: Revenue Share of Top 10 Territories
The proportionate revenue share for the best-performing nations is displayed In Figure 3.11. Their dominance in the dataset is further supported by the fact that the US and UK alone generate over 70% of overall revenue.
Figure 8: Revenue Share of Top 10 Territories
The proportionate revenue share for the best-performing nations is displayed In Figure 3.11. Their dominance in the dataset is further supported by the fact that the US and UK alone generate over 70% of overall revenue.