Clement Airiohuodion

Welcome to My Page
Power_BI_Project
📊 Power Bi: Global Population Urban-Rural Dynamics
📅 Date: May 2024 🌍 Domain: Global Development | Demographics 📌 Tool: Power BI 🗂️ Dataset: Population Dynamics: Urban and Rural Data (1960–2050)
🧠 Project Overview
This Power BI project visualizes global urban and rural population trends from 1960 to 2050, using historical data and projected estimates. Designed for NGOs and policymakers, the dashboard offers insights into demographic shifts and economic divides between urban and rural regions across income groups and continents.
The visuals enable planners to interact with population trends by Income Group, Region, Year, and Country, supporting long-term urban planning, rural policy design, and sustainability efforts.
🎯 Objectives
- Explore historical and projected urban vs. rural population trends.
- Identify economic disparities across income groups and regions.
- Provide interactive visual tools for demographic insights.
- Support decision-making using Power BI’s advanced features.
⚙️ Dashboard Features
| 📈 Visual Type | 💡 Description |
|---|---|
| Donut Chart | Highlights global urban vs. rural population proportions. |
| Stacked Area Chart | Shows urban growth over time alongside rural stability. |
| Map | Geographical distribution of population with tooltips. |
| Clustered Bar Chart | Compares rural/urban shares across income groups. |
| Clustered Column Chart | Tracks population trends over historical and projected years. |
Each visual is powered by custom DAX measures, data model relationships, and field hierarchies, enhancing interactivity and drill-down functionality.
🧮 Key Measures Created
- Total Population = Urban + Rural
- % Urban Population = (Urban / Total) × 100
- % Rural Population = (Rural / Total) × 100
- Average Growth Rate % = Mean of annual % change
- Date Formatting = Converts
Yearto full datetime - Period Classification = Historical vs. Projected (2022 cut-off)
🧱 Data Processing Workflow
-
Imported and cleaned:
Country GroupingstablePopulation Figures & Projections.csv
- Removed null rows and renamed ambiguous columns.
- Created relationships using Country Code (1:Many cardinality).
- Built hierarchies: Income Group → Region → Country.
- Created visual and numeric KPIs using DAX and calculated columns.
🧭 Slicer Filters
- Income Group
- Region
- Country
- Year (1960–2050)
These slicers improve the exploratory power of the dashboard, allowing dynamic filtering for precision insights.
🖼️ Sample Dashboard Visual
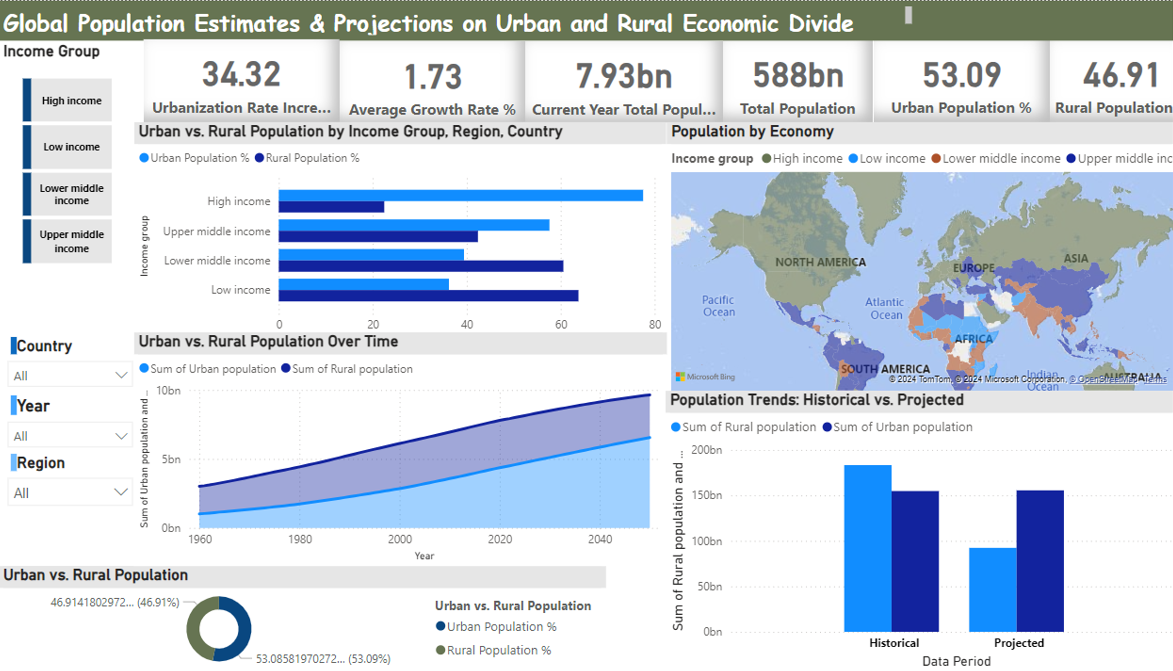
📌 Tip: Replace the placeholder path above with the actual image location from your repo (if hosted on GitHub).
🧩 Insights & Interpretation
- Urbanization is accelerating, especially in high-income regions.
- Asia and Africa will see over 90% of urban growth by 2050.
- Rural populations remain dominant in low-income areas.
- Slicers and visual interactions allow deep regional and temporal comparisons.
🔚 Conclusion
This Power BI project is a comprehensive tool for urban-rural population analysis over time. It demonstrates how data storytelling and interactivity can support development policies, sustainability programs, and economic planning. Future work can incorporate metrics like life expectancy and migration trends for deeper insights.